 EN
EN


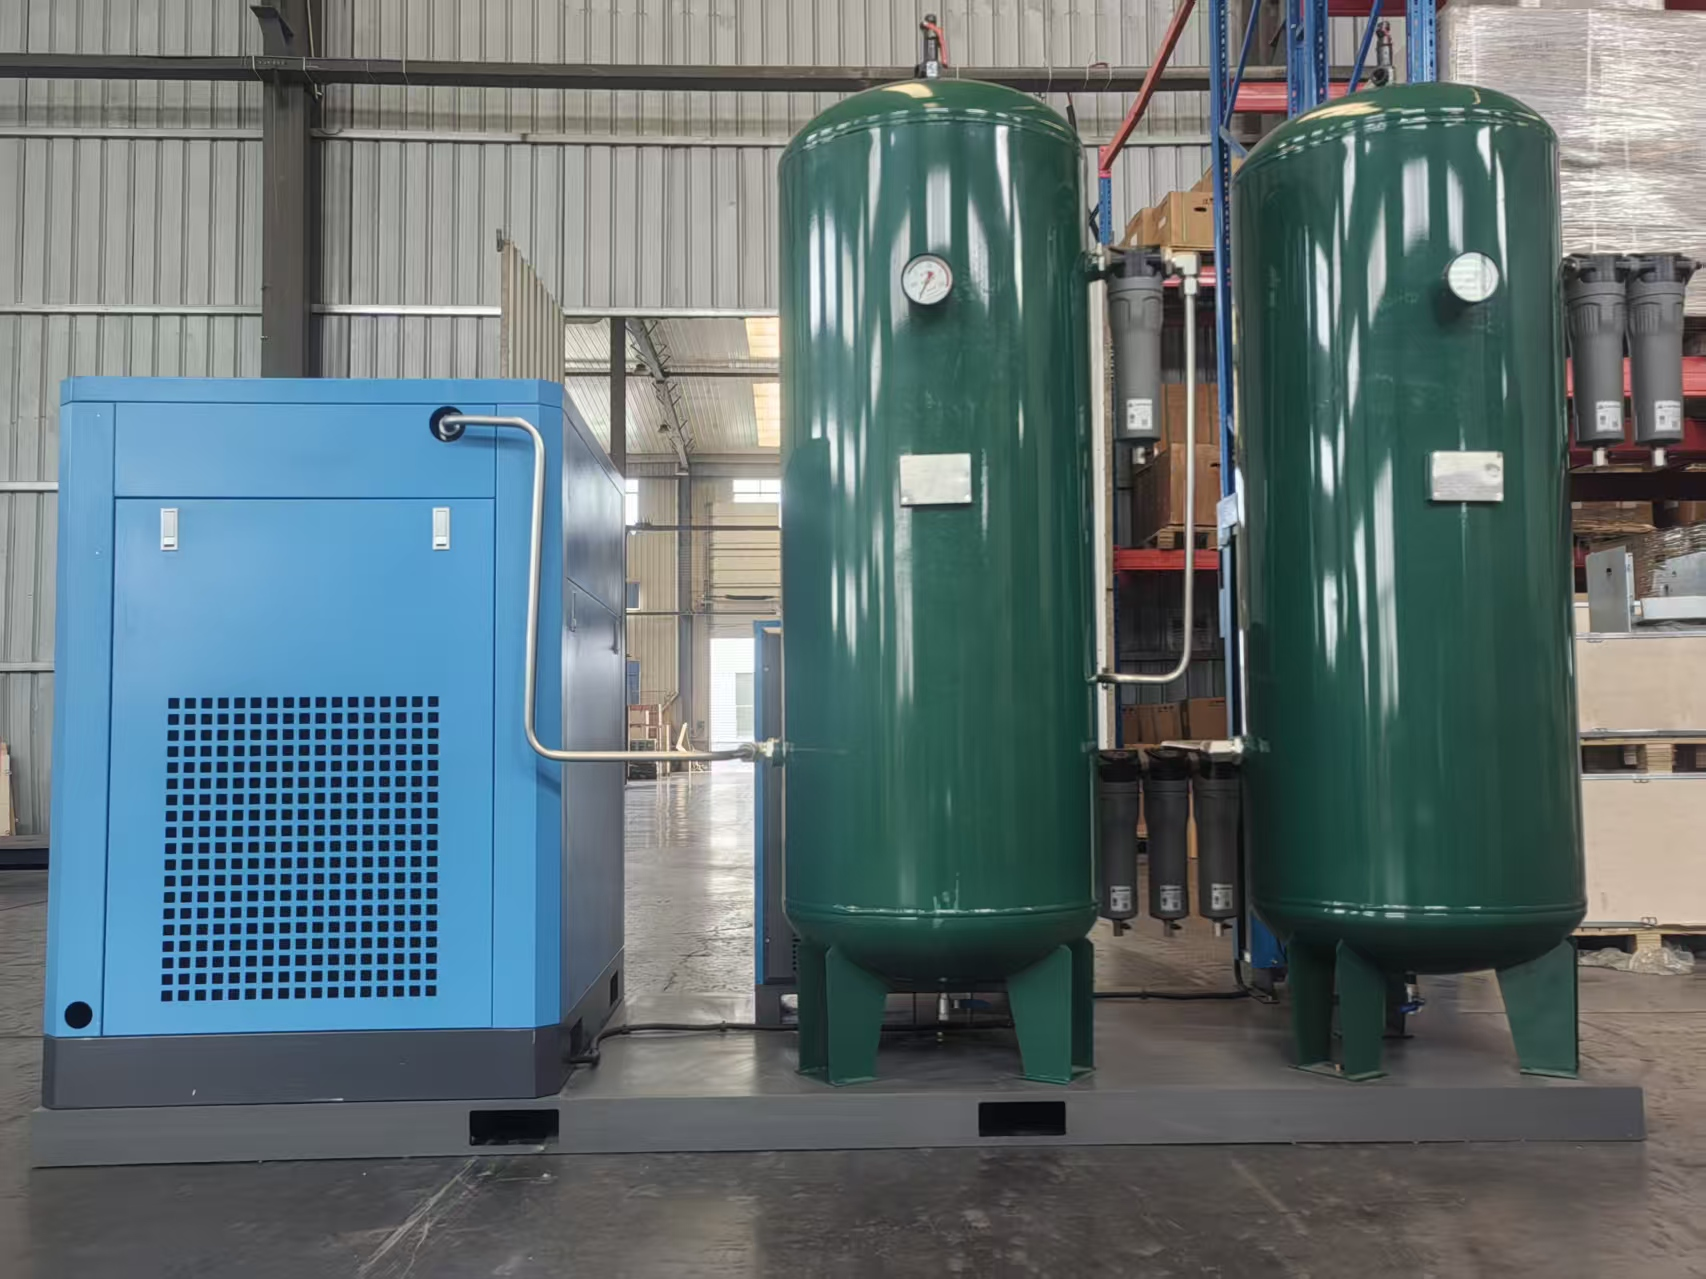
The 15% Throughput Drop – When Average CFM Wasn't Enough
An automotive assembly plant commissioned a new 150 HP rotary screw compressor sized precisely to the summed nameplate ratings of all pneumatic tools on the line. Total calculated demand: 510 CFM. The compressor rating: 520 CFM. On paper, it was a perfect match. In practice, the line's automated clamping stations—20 cylinders actuating simultaneously every 45 seconds—created 700 CFM peaks that dropped system pressure below 85 PSI. Tools stalled, robots missed cycles, and throughput fell 15% within the first week. The plant had to add a secondary 100 HP compressor as a peak‑shaving unit, costing $45,000 in unplanned capital and installation—not to mention the lost production.
This scenario is more common than most facility engineers admit. Over the past six years, compressed air consultants have observed that sizing compressors solely on average or nameplate ratings consistently leads to underperformance, pressure instability, and costly retrofits. Understanding real air demand isn't just about CFM numbers; it is about peak events, leakage, distribution losses, and the operational dynamics that define actual assembly‑line requirements.
Peak vs. Average CFM – The Hidden Demand Gap
Nameplate ratings on air tools reflect average free air delivery—not real‑world pressure and flow dynamics on a large‑scale assembly line. Sizing a compressor solely on summed tool averages risks chronic underperformance when multiple pneumatic actuators, conveyors, and blow‑off stations cycle simultaneously.
| Demand Type | Typical Value | When It Occurs | Impact on System |
|---|---|---|---|
| Average CFM | 200–400 CFM | Sustained production | Steady load; manageable |
| Peak CFM | 500–700 CFM | Simultaneous automation events | Pressure drop (<90 PSI) |
| Shift variability | ±20% | Between shifts | Compressor cycling |
| Late‑cycle testing | +40% spike | End of line testing | Additional demand surge |
A typical shift may sustain 200–400 CFM, but automation events—like 20 cylinders clamping within 2 seconds—can spike demand to 700 CFM for brief bursts. Unaddressed, these peaks drop system pressure below 90 PSI, causing incomplete tool strokes and unplanned downtime. One leading automotive plant saw 15% lower throughput after commissioning a compressor matched only to average load. Monitoring across shifts reveals further complexity: second‑shift demand often falls 20%, yet late‑cycle testing can spike consumption by 40%. Capacity planning must therefore account for both sustained base load and intermittent automation‑driven peaks—not just manufacturer‑rated CFM at a single pressure.
Air Audit Methodology – Capturing Load Variability with Flow Meters and Data Loggers
A rigorous air audit moves beyond static pressure checks and uses calibrated thermal mass flow meters paired with data loggers to build an accurate demand profile. Aligned with the ASME EA‑4‑2010 standard, a typical assessment deploys flow meters at the compressor discharge and main header—recording flow every second—while pressure sensors at critical endpoints identify distribution losses.
| Audit Step | Equipment | Data Captured | Duration |
|---|---|---|---|
| Discharge monitoring | Thermal mass flow meter | Total CFM output | 7 days |
| Distribution monitoring | Pressure sensors at endpoints | Pressure drop per zone | 7 days |
| Peak capture | Data logger with 1‑sec interval | Spike frequency and duration | 7 days |
| Air quality | Dew point sensor | Moisture content during surges | Continuous |
Over a 7‑day period, this instrumentation captures not only average CFM but also the frequency, magnitude, and duration of demand spikes. For example, an electronics assembly line audit revealed that 30% of daily air consumption occurred in just 15‑minute bursts during automated test fixture activation. Such granularity clarifies whether a 50 HP compressor will run unloaded 80% of the time—or whether a 75 HP unit barely covers peak demand with no margin for leakage. Flow meters should be bidirectional if storage receivers are present, as reverse flow during blow‑downs can distort readings. Data loggers also track dew point, ensuring air quality metrics align with demand surges. Without this empirical variability, capacity modeling remains speculative—not engineering.
Calculating Accurate Compressor Capacity Requirements
Total Sustained CFM for Pneumatic Tools, Conveyors, and Actuators
Accurate industrial compressor sizing starts with a detailed inventory of all air‑consuming components—pneumatic tools, conveyors, actuators, and blow‑off nozzles—and applies realistic duty cycles and simultaneity factors. Summing nameplate CFM ratings alone overstates demand: tools rarely operate continuously at full load.
| Factor | Typical Value | Purpose |
|---|---|---|
| Operating factor | 50–70% | Reflects actual tool run time |
| Simultaneity factor | 70–90% | Tools operate concurrently |
| Leakage reserve | 25–30% | Compensates for system losses |
| Expansion margin | 10–15% | Future capacity needs |
A 60% operating factor and 80% simultaneity factor, for instance, significantly reduce the effective sustained load. The calculation is:
Total sustained CFM = Σ (rated CFM × operating factor × simultaneity factor) + leakage reserve + future expansion margin
Compressed air leaks alone waste 20–30% of total system output (U.S. DOE), making a 25–30% buffer for leakage and growth essential. Skipping this disciplined approach risks either under‑sizing—causing pressure drops and stoppages—or over‑sizing—wasting energy and inflating maintenance costs.
Matching Operating Pressure (90–100 PSI) to Tool Specs and Distribution Losses
Most assembly‑line pneumatic tools and actuators require 90–100 PSI for reliable operation. But the industrial compressor must deliver higher discharge pressure—to offset typical distribution losses of 5–15 PSI across dryers, filters, and piping.
| Pressure Component | Typical Value | Purpose |
|---|---|---|
| Tool requirement | 90–100 PSI | Minimum at point of use |
| Distribution loss | 5–15 PSI | Dryers, filters, piping |
| Compressor discharge | 100–110 PSI | Compensates for losses |
| Energy penalty | +1% per 2 PSI excess | Avoid over‑pressurization |
Setting discharge pressure to 100–110 PSI ensures tools receive their required minimum at the point of use. Arbitrarily raising system pressure is counterproductive: every 2 PSI above necessity increases energy consumption by ~1% (U.S. DOE Compressed Air Systems Best Practices). Therefore, calibrate discharge pressure precisely to the highest tool requirement—plus only the verified pressure drop across the system.
Selecting the Optimal Compressor Type – Rotary Screw vs. Reciprocating
| Parameter | Reciprocating Compressor | Rotary Screw Compressor |
|---|---|---|
| Duty cycle capability | 60–70% | 100% continuous |
| Air quality | Pulsing | Steady, pulse‑free |
| Specific power (kW/100 CFM) | Baseline | 10–15% lower |
| Maintenance interval | Valve/ring replacement (2,000–4,000 hrs) | Oil change (4,000–8,000 hrs) |
| Best application | Intermittent, low‑duty | Continuous, high‑reliability lines |
For high‑reliability assembly‑line service, reciprocating compressors—with their typical 60–70% duty cycle—are ill‑suited for continuous multi‑shift operation and prone to overheating and air starvation. Rotary screw industrial compressors, by contrast, are engineered for 100% continuous duty, delivering steady, pulse‑free airflow essential for precision pneumatic tools. They also offer superior efficiency: at full load, rotary screw units achieve 10–15% lower specific power (kW/100 CFM) than comparable reciprocating models (2024 industry benchmarks). Maintenance intervals reinforce the advantage—rotary screw compressors require oil changes only every 4,000–8,000 hours, while reciprocating units demand frequent valve and ring replacements. On high‑volume lines where uptime is non‑negotiable, the rotary screw's durability, stable output, and lower lifecycle cost make it the de facto standard.
Building in Scalability and Safety Margins – The 25% Buffer
Designing a compressor system strictly to calculated demand invites performance degradation over time. A 25% capacity buffer accommodates three interrelated realities: leakage (typically 20–30% of total output across aging fittings), cumulative pressure drop in distribution piping, and future expansion—such as added tools or automated modules.
| Buffer Component | Typical Value | Purpose |
|---|---|---|
| Leakage allowance | 20–30% | Compensates for system losses |
| Pressure drop reserve | 5–15 PSI | Accounts for distribution losses |
| Expansion margin | 10–15% | Future automation additions |
| Total buffer | 25–30% | Engineered resilience |
This headroom prevents pressure fluctuations that erode tool performance, compromise part quality, and trigger unplanned maintenance. It's not excess capacity—it's engineered resilience. Specifying a compressor with this reserve ensures long‑term stability, avoids costly mid‑life upgrades, and sustains production integrity across the facility's operational lifespan.
System Integration – The BXKM Perspective
Achieving reliable compressed air performance requires more than selecting a compressor based on nameplate ratings—it demands a systematic approach to demand assessment, pressure management, and future scalability. BXKM's engineering expertise in auxiliary equipment for industrial processing supports the reliability of production systems through thoughtful integration of utility and process equipment. By understanding the interdependencies between compressed air systems and the auxiliary machinery they support—such as material handling, mixing, and conveying equipment—BXKM helps industrial facilities achieve consistent production output and reduce unplanned downtime. This comprehensive support, combined with a responsive supply chain, ensures that both primary and auxiliary equipment remain productive and reliable.
FAQ
| Question | Answer |
|---|---|
| What is the difference between peak and average CFM demand? | Peak CFM is short‑term, high‑demand during automation events. Average CFM is sustained consumption across shifts. Both must be accounted for in sizing. |
| How can I determine accurate compressor capacity requirements? | Inventory all air‑consuming components, apply operating and simultaneity factors, and add buffers for leakage (25–30%) and future expansion. An air audit provides the highest fidelity. |
| Why are rotary screw compressors preferred for assembly lines? | They offer 100% continuous duty, stable pulse‑free airflow, 10–15% better efficiency, and maintenance intervals of 4,000–8,000 hours—making them ideal for high‑reliability lines. |
| What is the importance of maintaining system operating pressure? | Tools require 90–100 PSI at point of use. Distribution losses (5–15 PSI) mean compressors must discharge at 100–110 PSI. Every 2 PSI excess adds ~1% energy cost. |
| Why is a capacity buffer important for industrial compressor systems? | A 25–30% buffer accommodates leakage, pressure drop, and future expansion—preventing pressure fluctuations and costly mid‑life upgrades. |
| What is the impact of air leaks on system efficiency? | Compressed air leaks waste 20–30% of total system output. A leakage reserve is essential for maintaining reliable system pressure. |